Probability Spinner: Count Sectors to Predict Which Color Wins
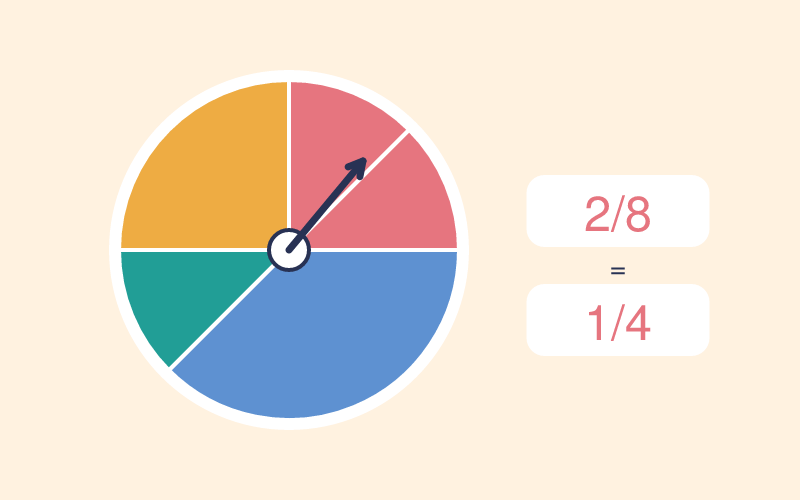
Spin the wheel, tally each color's sectors, and turn those counts into probability fractions. You practice reasoning from a fixed sample space instead of trusting a single lucky spin.
A Bigger Sector Is Not a Promise: Where Likely Slips Into Certain
Grade 7 students often stall the moment a spin lands on an unlikely color and they decide the model was wrong. The trap is treating "most likely" as a guarantee for the very next spin rather than a long-run rate. Because every sector is drawn to scale, systematic counting of target sectors over the total keeps the fraction steady even when one result surprises you. Recording 20 simulated spins beside your predicted fraction makes the gap between theoretical probability and experimental frequency visible, not abstract. The wheel keeps the sample space in front of the learner so the count, not the last outcome, drives the answer.
Grade 7 Probability: Building Sample-Space Reasoning Before Compound Events
This game sits at Grade 7, where equal-outcome counting (7.SP.C.5) grows into estimating probability from data (7.SP.C.6) and building a probability model (7.SP.C.7). It leans on earlier fraction fluency—part over whole—and sets up compound events and tree diagrams in later study. Comparing predicted and observed frequencies here is the bridge from single-event chance toward experimental design.
Three Probability Skills Practiced While Reading the Spinner
- Count the sample space by identifying all equal spinner sectors.
- Represent probability as target color sectors over total sectors.
- Compare likelihood using sector counts, complements, and probability fractions.
Three Moves to Judge Chance: Count, Write, Compare
- Count the total spinner sectors and check that they are equally likely.
- Find the target color label and count its sectors.
- Write the probability fraction and simplify if needed.
- For most-likely or complement questions, compare sector counts or subtract from 1.
Five-Minute Teacher Routine: Predict, Then Record 20 Spins
Have students write the probability fraction from the spinner sectors, then record 20 simulated spins. Comparing prediction and frequency makes the distinction clear.
Probability Spinner Questions Teachers Hear
Q: Why does the most likely color not always appear next?
A: Probability describes a long-run pattern, not a guarantee for one spin. A larger sector is more likely, but another color can still occur.
Q: Why does experimental frequency differ from theoretical probability?
A: Small samples vary. After 10, 20, or 30 spins, the frequency often moves closer to the theoretical probability.