Stats Arcade: Compute Mean, Median, Mode, and Range to Beat Each Round
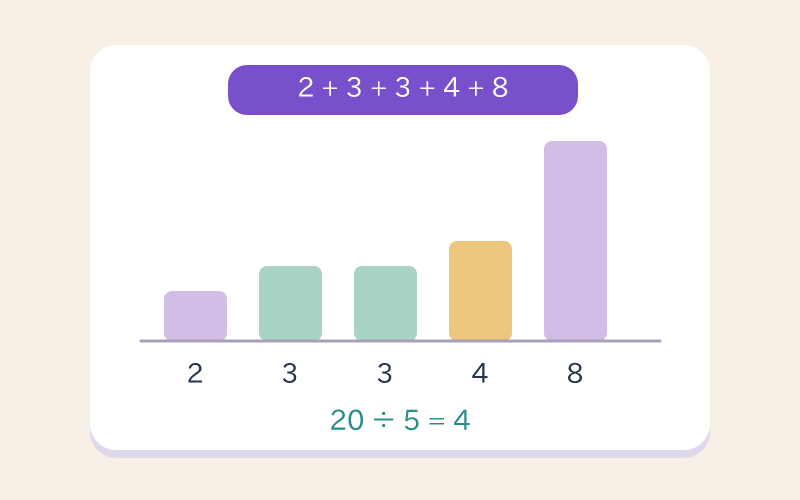
Read four fresh data sets and calculate their mean, median, mode, and range. Questions and answers are shuffled, and replay generates new data.
Identify the Statistic Before Choosing a Calculation
Mean uses the total divided by the count; median needs sorted values; mode counts repetitions; range subtracts the smallest value from the largest. Stats Arcade generates four fresh data sets per run, with one task for each statistic. Read the labeled bars, work out the requested value, then choose an answer. Both task and answer order are shuffled. The result counts correct answers across four tasks, and Play again generates another set.
From Tallying Arcade Scores to Judging Which Average Fits (Grades 4-7)
Grades 4–5 can begin by reading data, adding values, and sorting. Grade 6 connects these skills to measures of center and variability (6.SP.A.3, 6.SP.B.5.c). The four tasks distinguish center from spread; teachers can follow a completed run by asking why different statistics describe the same data in different ways.
Learning Points
- data collection
- graph representation
- measures of center
- theoretical and experimental probability
Steps and completion rules
- Read which statistic is requested, then list every value in the set.
- Use total divided by count for mean, sort for median, count repeats for mode, or subtract minimum from maximum for range.
- Choose the result and finish the set, noting why the four statistics can differ.
Teacher / Parent Note
Ask for one line of calculation or sorting evidence. The tallest bar is not automatically the answer to every statistics question.